Elon Musk has been in the news recently, and when I saw that he appeared on The Joe Rogan Experience (JRE), I became curious about the number of views that various JRE podcasts get.
I grabbed the view data from Youtube on May 8, 2020. Here are the top 30 most-viewed videos on the PowerfulJRE channel:
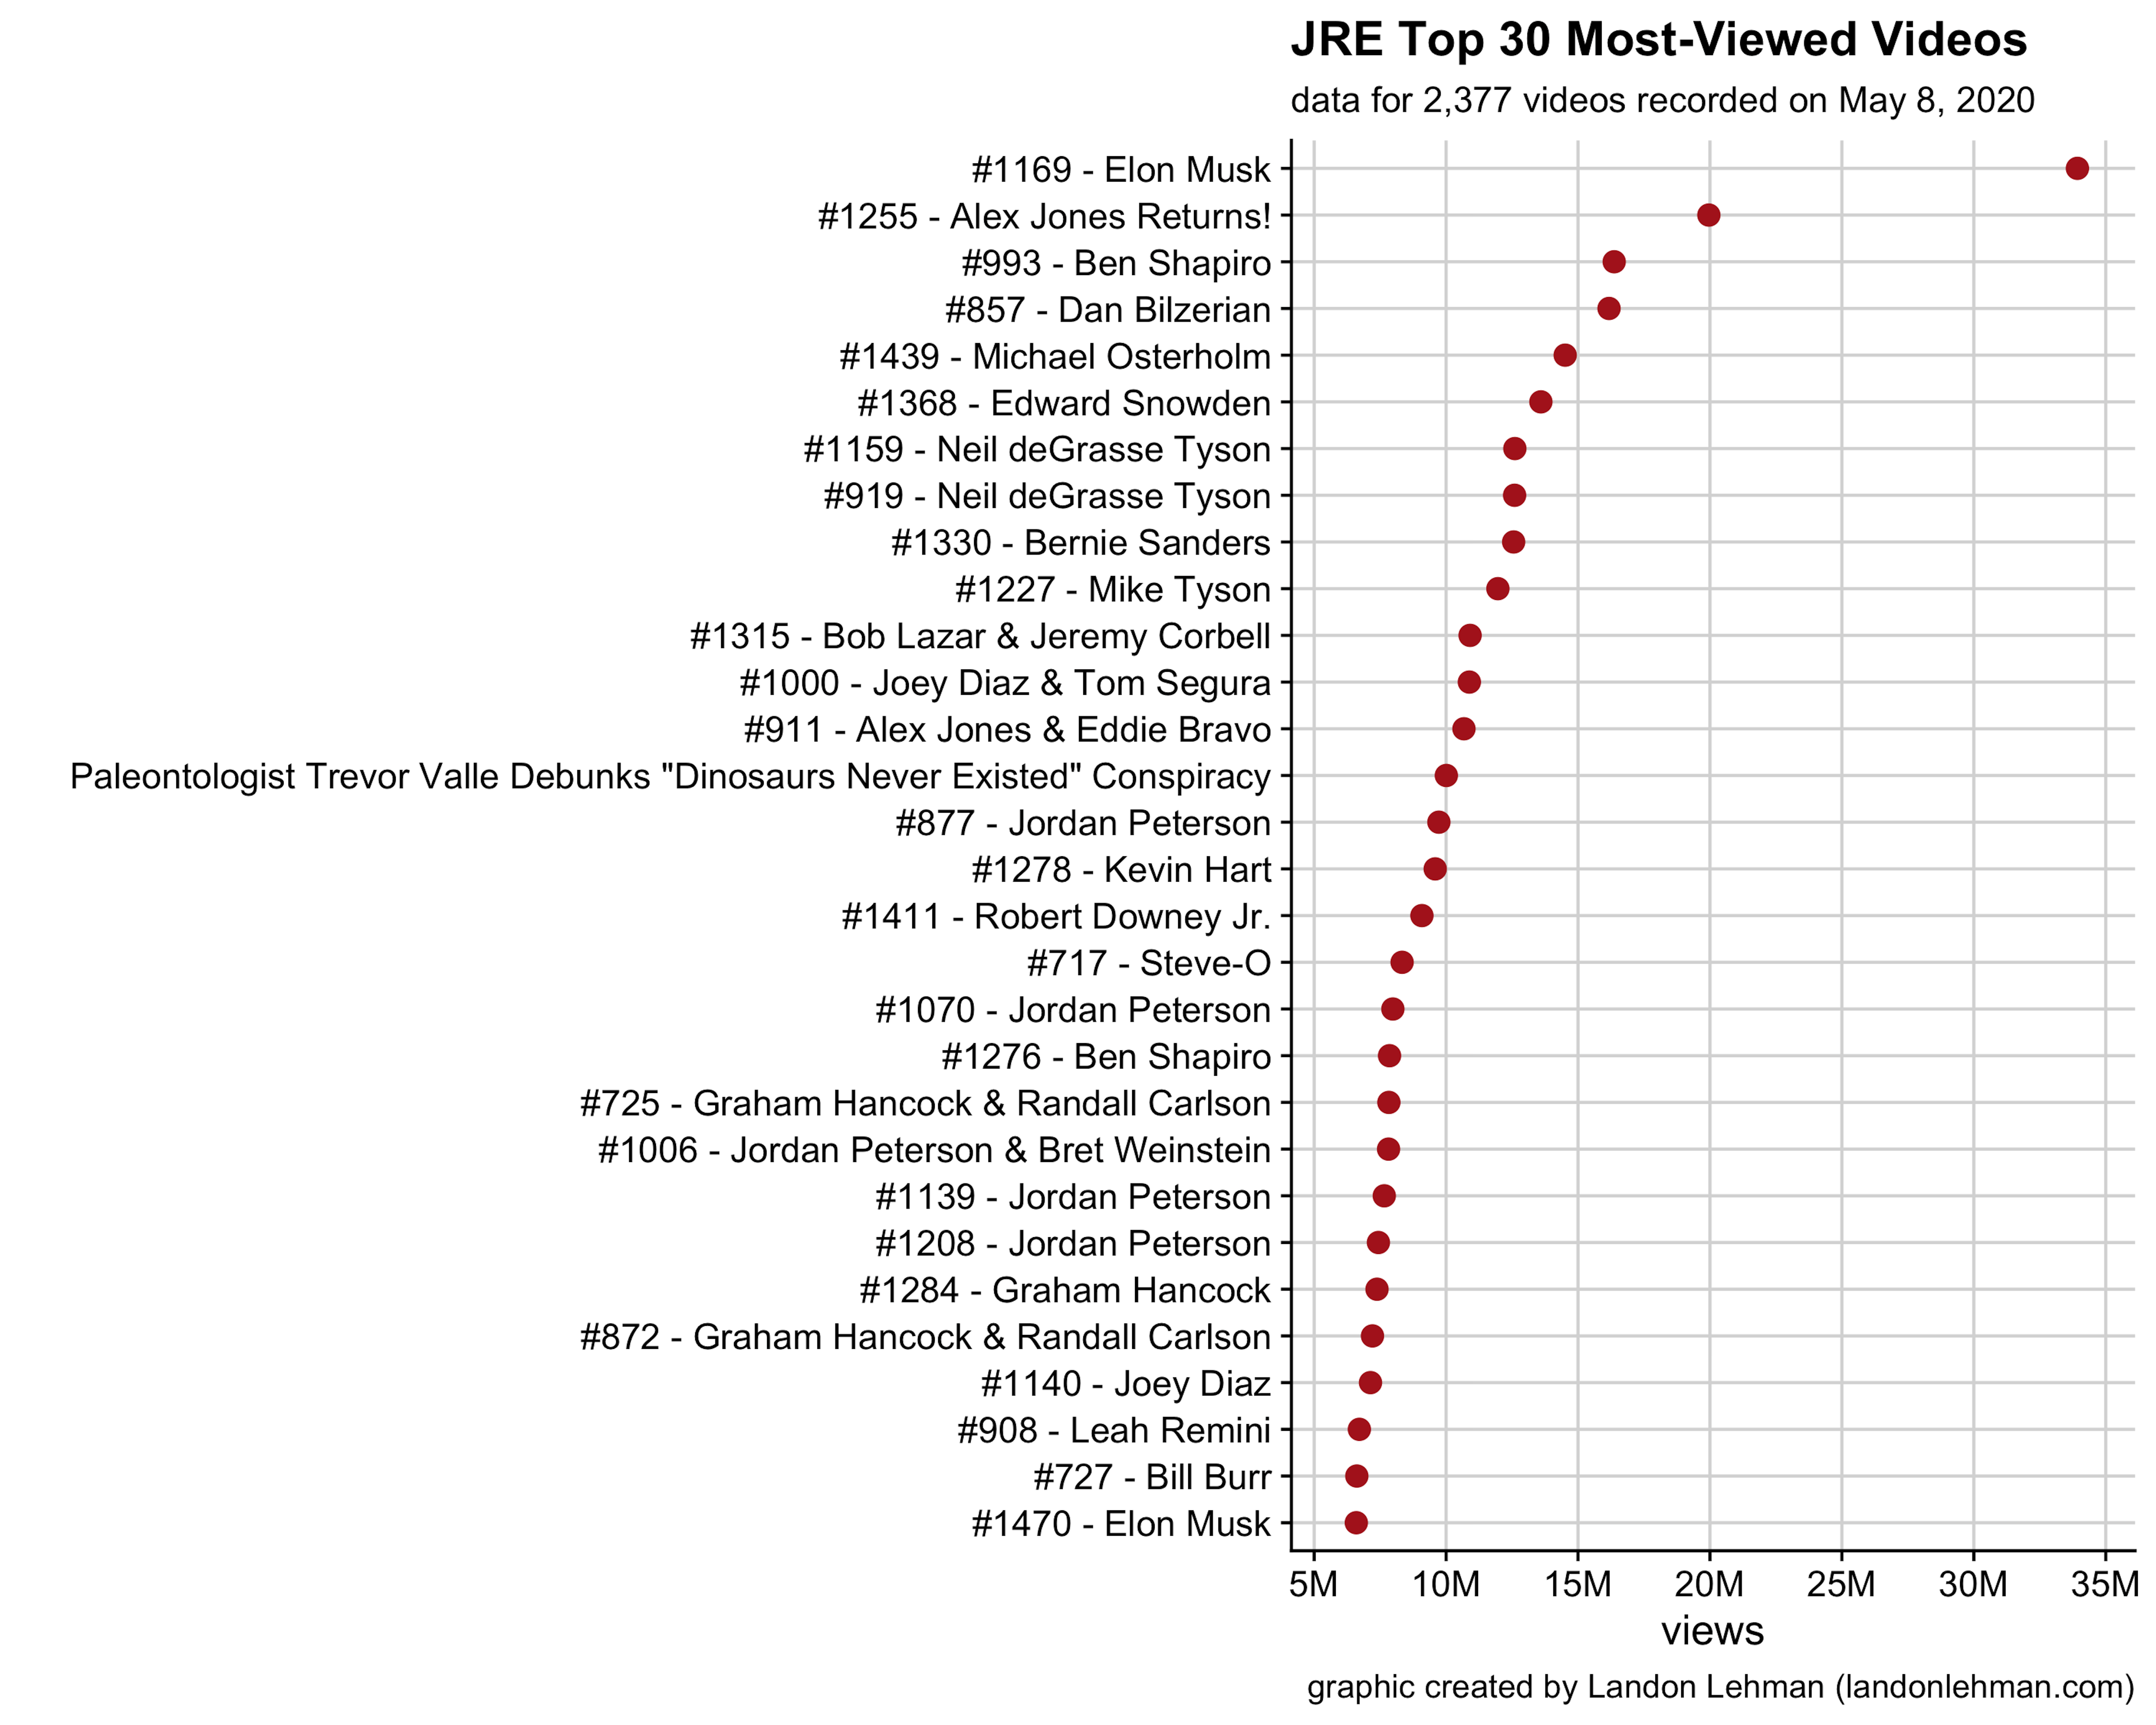
Musk’s first appearance on #1169 has by far the most views of any JRE episode - almost 35 million! The May 7th appearance on #1470 was already the 30th most-viewed video on May 8, and has probably moved up since then.
I was curious about the distribution of views. One way to get a sense of how the tails of the distribution behave is to plot the empirical cumulative distribution function, or the ECDF. This is a mouthful, but it just means plotting views on the x-axis, and the ratio of the number of videos reaching a certain number of views to the total number of videos on the y-axis. Here is the ECDF, plotted on a log-log scale:
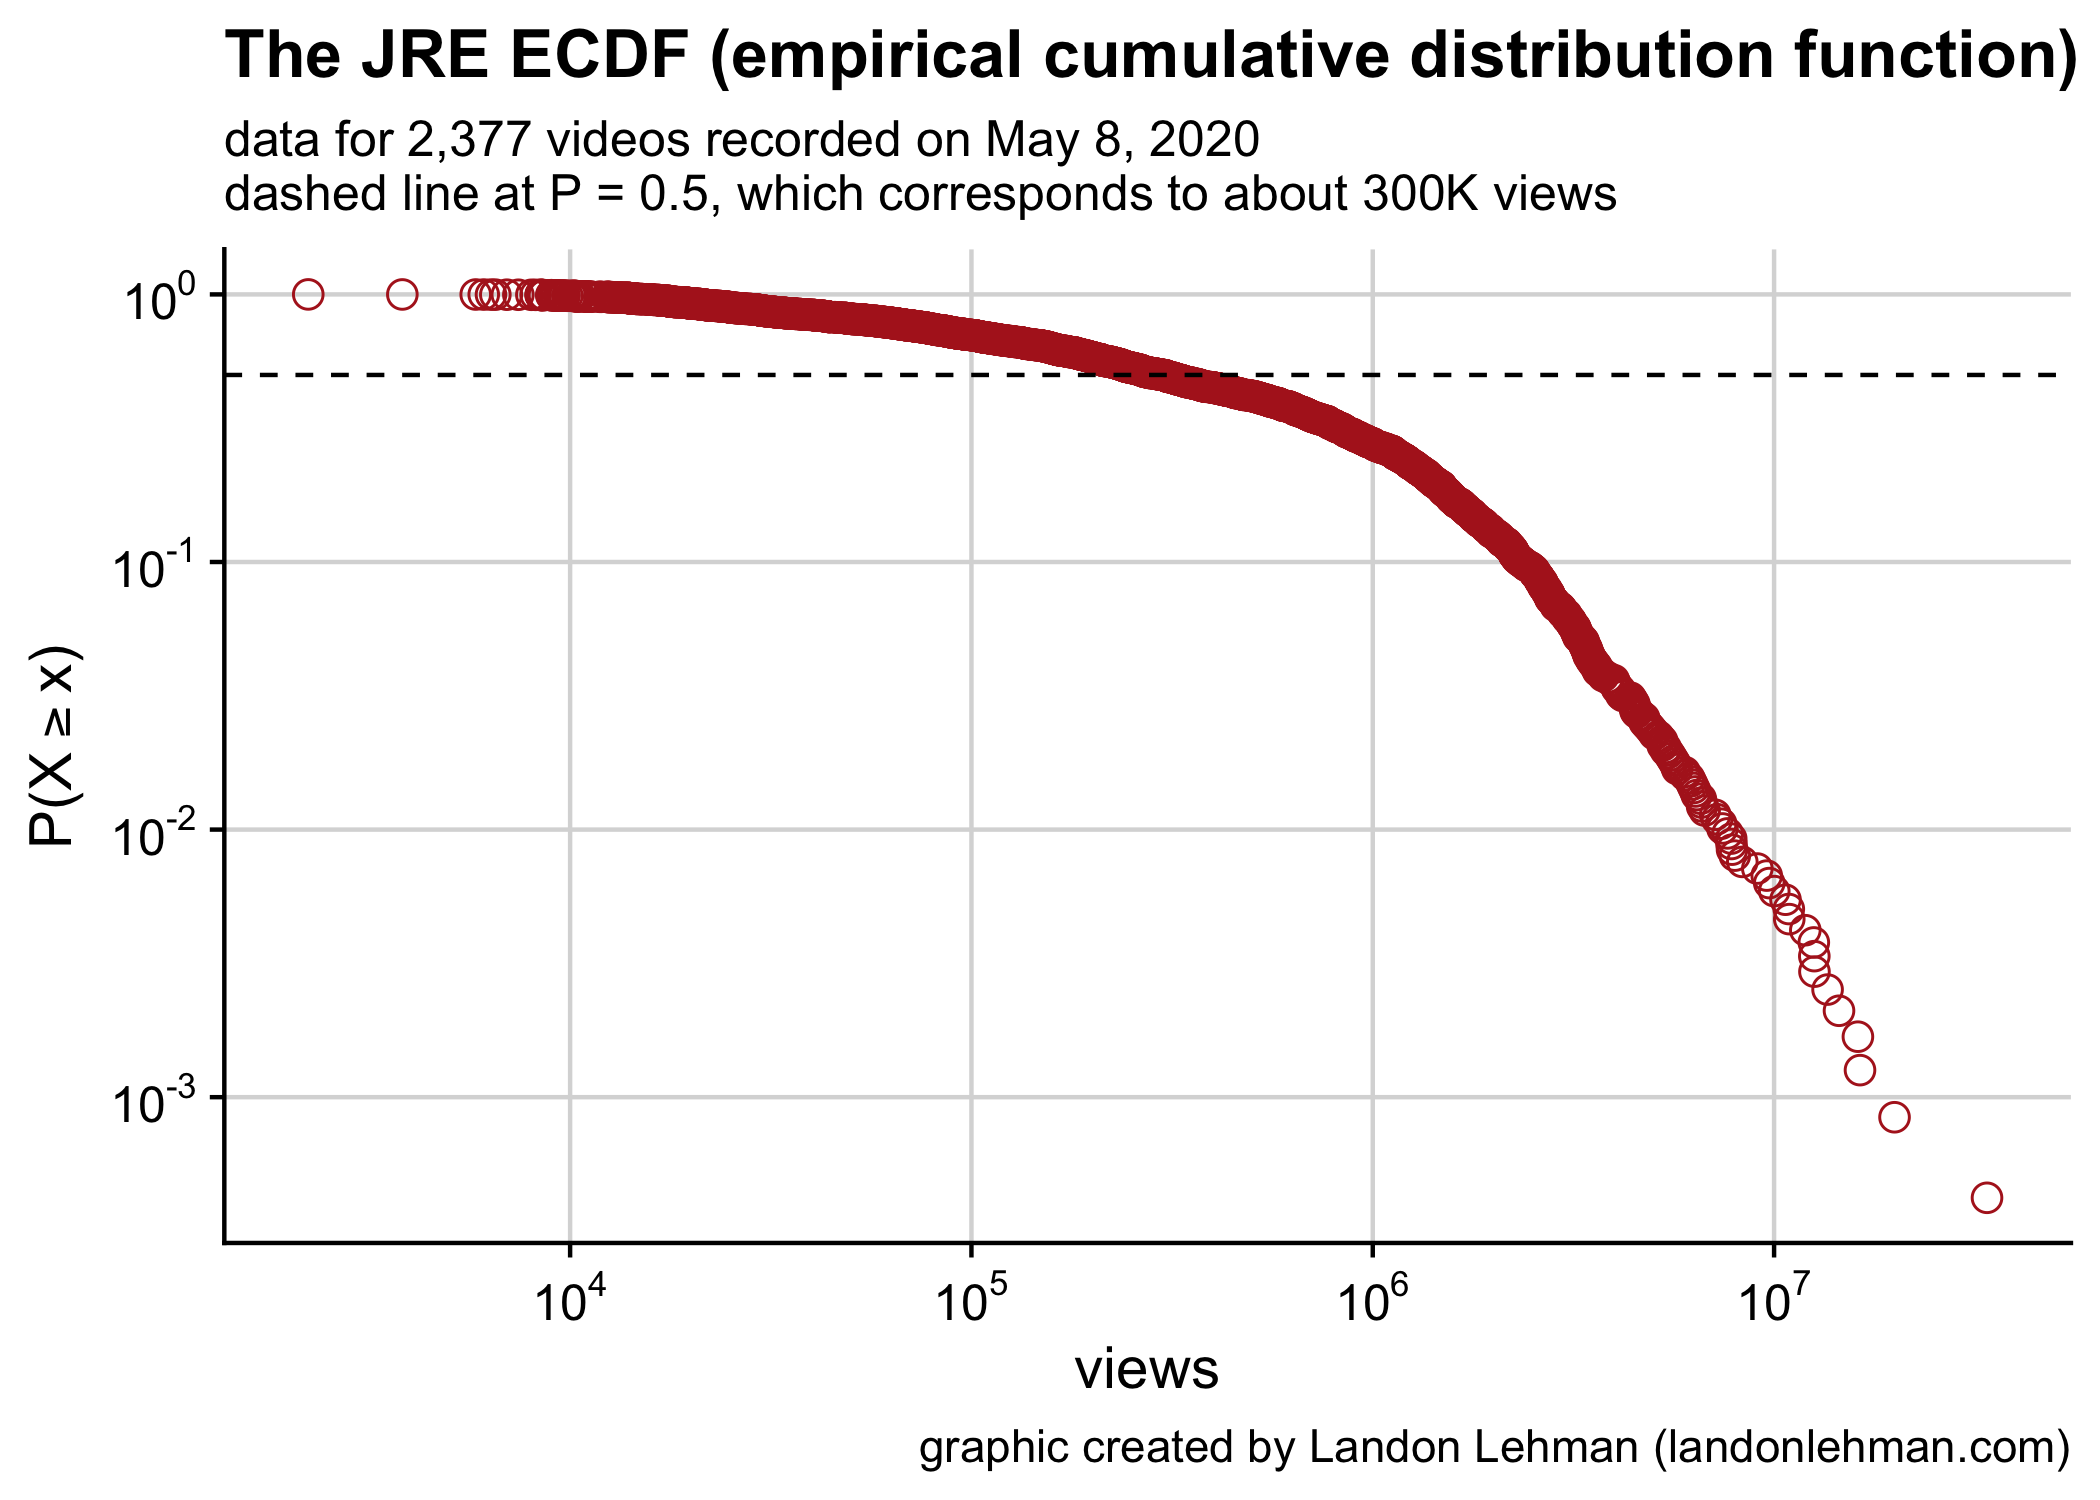
The first Elon Musk appearance is the point that is lowest and furthest to the right.
I plotted the distribution this way because I wanted to see if it resembled a power law. Quantifying how similar the distribution is to a power law (or deciding if it resembles a power law at all) is complicated, and something I might address in a future post.
If you pick a video from the channel at random, there is a 50% chance that it has 300K or fewer views. I didn’t filter for just JRE episodes, so this includes various small clips and videos that are not full-length podcast episodes. Here are some other quantiles:
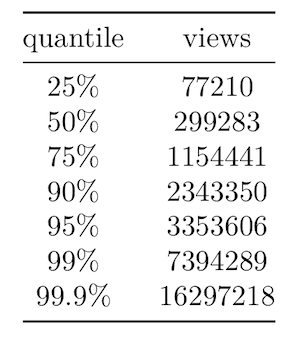
Views are not necessarily in a one-to-one correspondence with people, but for an order-of-magnitude comparison, the current US population is about 330 million.