Once upon a time, in a small town, there were two carpenters: Bob and Tom. Bob was an honest, hardworking carpenter with a good reputation. Tom was a somewhat incompetent carpenter with shady business practices.
At one point in time, Bob and Tom had each completed 100 carpentry jobs. Bob’s customers were satisfied with 90 out of his 100 jobs. Tom’s customers were satisfied with 95 out of his 100 jobs. So Tom (the incompetent carpenter) put up a sign saying “Best Success Rate in Town! 95% Customer Satisfaction! 5% More Satisfaction than Closest Competitor!”
Now, Tom’s sign was technically correct. But here are the details. Bob’s 100 jobs consisted of 90 window replacements and 10 lightbulb replacements. Bob had 10 unsatisfed window replacement customers and no unsatisfied lightbulb replacement customers. Tom’s 100 jobs consisted of 95 lightbulb replacements and 5 window replacements. Tom had 4 unsatisfied window replacement customers and 1 unsatisfied window replacment customer. Here is a table showing the unsatisfied customers:
| Job Type | Bob | Tom |
|---|---|---|
| Window | 10/90 = 11.1% | 4/5 = 80% |
| Lightbulb | 0/10 = 0% | 1/95 = 1.1% |
| Total | 10/100 = 10% | 5/100 = 5% |
So, Tom does have a better aggregrate success rate. But, if you want a lightbulb replacement done, Bob is better at down lightbulb repairs (he has never messed one up). And if you want a window replacement done, Bob is also better at window replacements (he gets it right about 9/10 times, and window replacements can be tricky).
This is an example of Simpson’s Paradox. Briefly stated, Simpson’s Paradox is the fact that associations can reverse direction when taking conditional probabilities. Another way of stating it is that aggregated and disaggregated data can show opposite results (in the above example the result is the answer to the question: “Which carpenter has a better satisfaction rate?"). Note that this second way of stating the paradox does not involve probability - Simpon’s Paradox is purely algebraic and not statistical.
One way of visualizing Simpson’s Paradox is to use vectors. I came across this method in the book Classic Problems of Probability by Prakash Gorroochurn. Let the slope of the vector represent the proportion of unsatisfied customers. Then for window replacements, Bob has the vector \((90, 10)\) and Tom has the vector \((5, 4)\).
For lightbulb replacements, Bob has the vector \((10, 0)\) and Tom has the vector \((95, 1)\). Here is a plot:
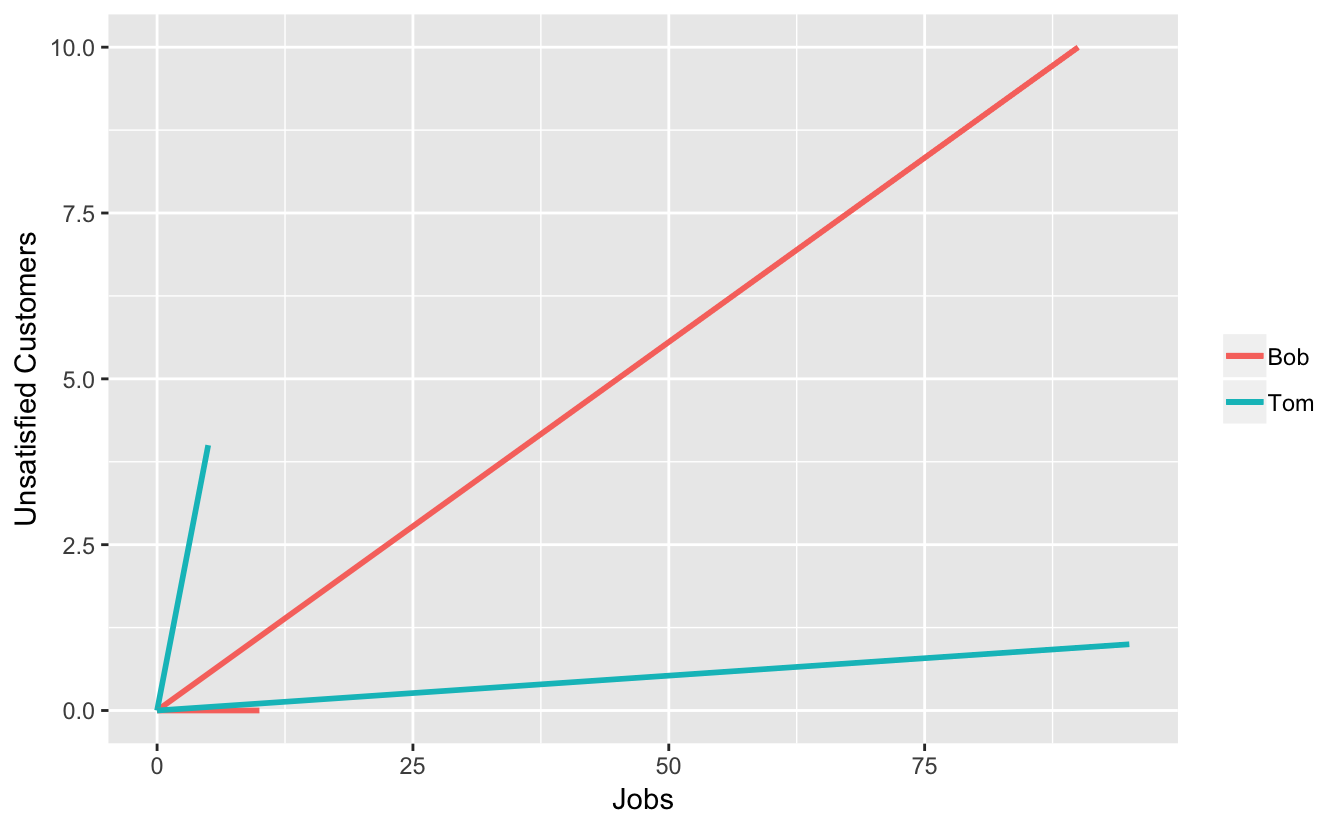 Note that for each type of job, Tom’s vector has a larger slope than Bob’s, meaning Tom had a greater proportion of unsatisfied customers. Now add each carpenter’s vectors to get the overall proportions:
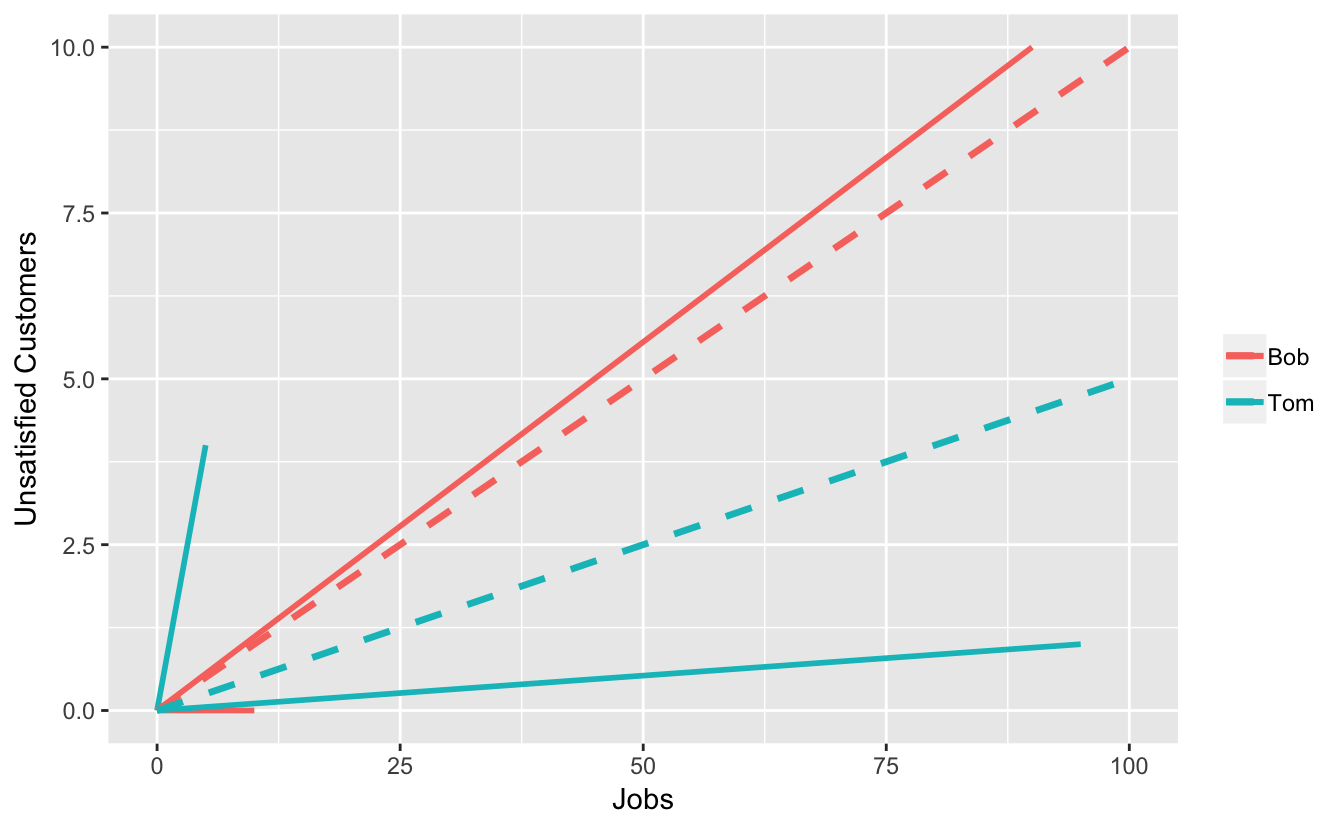 The vector sums are drawn as dashed lines. Bob’s overall vector has a higher slope than Tom’s, even though the two vectors that contributed had lower slopes than the respective ones for Tom.