Consider the uniform distribution on $[-1, 1]$, and take $N$ points from this distribution. What is the mean distance from the origin to the nearest point?
If you take the median instead of the mean, you get the answer outlined in my last post. The mean makes things more challenging. Here is a solution that makes sense to me. I am sure there is a more formalized way to go about this, but I was trained as a physicist, so I tend to use “informal” mathematics.
Let’s start simply, and only consider $N = 2$ points. Then the probability that the nearest point is at a distance $r$ from the origin is equal to the probability that the other point is not within a distance $r$, multiplied by the probability that a point is at a distance $r$. As an equation $$ \Pr(\text{closest point is at } r) = \Pr(\text{other point is } > r) \times \Pr(\text{one point is at } r). $$ The probability that the other point is at a distance greater than $r$ is $(1-r)$ (for the reasoning see my previous post). The probability that one point is at $r$ is $(1/2)\times 2 = 1$. The factor of $1/2$ is because $p(x) = 1/2$ for the uniform distribution on $[-1, 1]$. We have to multiply by $2$ because there are two ways to be at a distance $r$ (to the right or to the left of the origin). Furthermore, we have to multiply by another factor of $2$ overall because there are two ways to pick which point is the “near” point and which point is the “far” point. So overall we have $$ \Pr(\text{closest point is at } r) = 2(1-r). $$
To get the mean distance to the nearest point, we calculate the expected value of the above distribution: $$ \operatorname{E}(r) = \int_0^1 r, \Pr(\text{closest point is at } r), \mathrm{d}r = \int_0^1 2 r (1-r) , \mathrm{d}r = \frac{1}{3}. $$ So for $N = 2$ points, the mean distance from the origin of the nearest point is $r = 1/3$.
Now generalize to $N$ points, following the same reasoning. We have to multiply by a factor of $N$ overall to account for the $N$ different ways to choose which point is the nearest point. This gives $$ \Pr(\text{closest point is at } r) = N(1-r)^{N-1}. $$ Integrating to get the expected value gives $$ \operatorname{E}(r) = \int_0^1 r, \Pr(\text{closest point is at } r), \mathrm{d}r = \int_0^1 r N (1-r)^{N-1} , \mathrm{d}r = \frac{1}{N+1}. $$ So as the number of points $N$ increases, the expected distance of the nearest point to the origin approaches zero, as expected (yes, I know puns are bad).
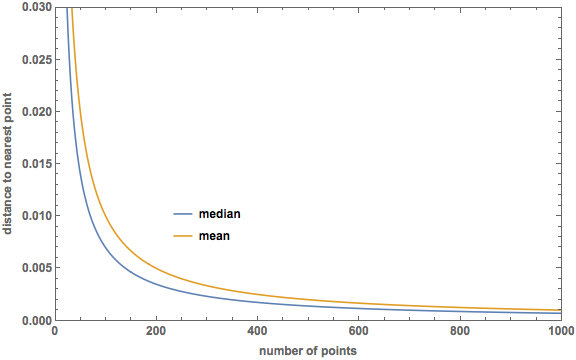
How does this compare to the median distance to the nearest point? This was calculated in the previous post, and turned out to be $$ m = 1 - \left( \frac{1}{2}\right)^{\frac{1}{N}}. $$ Both equal $1/2$ when $N = 1$, and beyond that the mean is greater than the median. I used Mathematica to make a plot of both median and mean for $N$ up to 1000:
And here is a plot of the difference (mean − median):
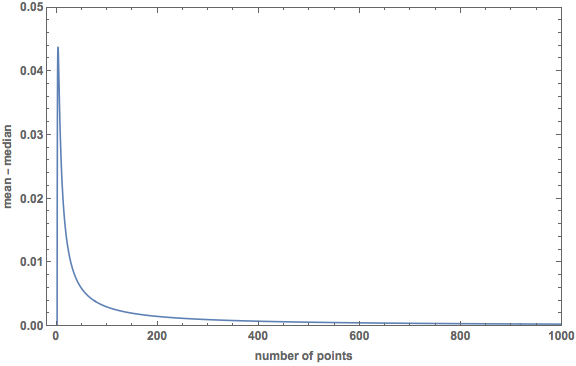
The difference reaches a maximum of $0.0439$ at $N = 2.7671$.
In my next post, I will extend this calculation of the mean distance to the nearest point to a uniform distribution over a $p$-dimensional unit sphere.