Some time ago, I took an exploratory look at the BLL (Basic Library List) published by the MAA (Mathematical Association of America). In this list, each book is tagged with “topics,” and can have a single topic or multiple topics.
At the time I wrote my previous post, I didn’t know of a good way to visualize the distribution of topics. I could isolate each topic (for example “History of Mathematics”) and count the books that had this topic, but this doesn’t show combinations of topics and how they overlap in a nice way.
I recently came across a method for dealing with this type of dataset: the upset plot. There are several implementations in R; I used the ComplexUpset package by Michał Krassowski.
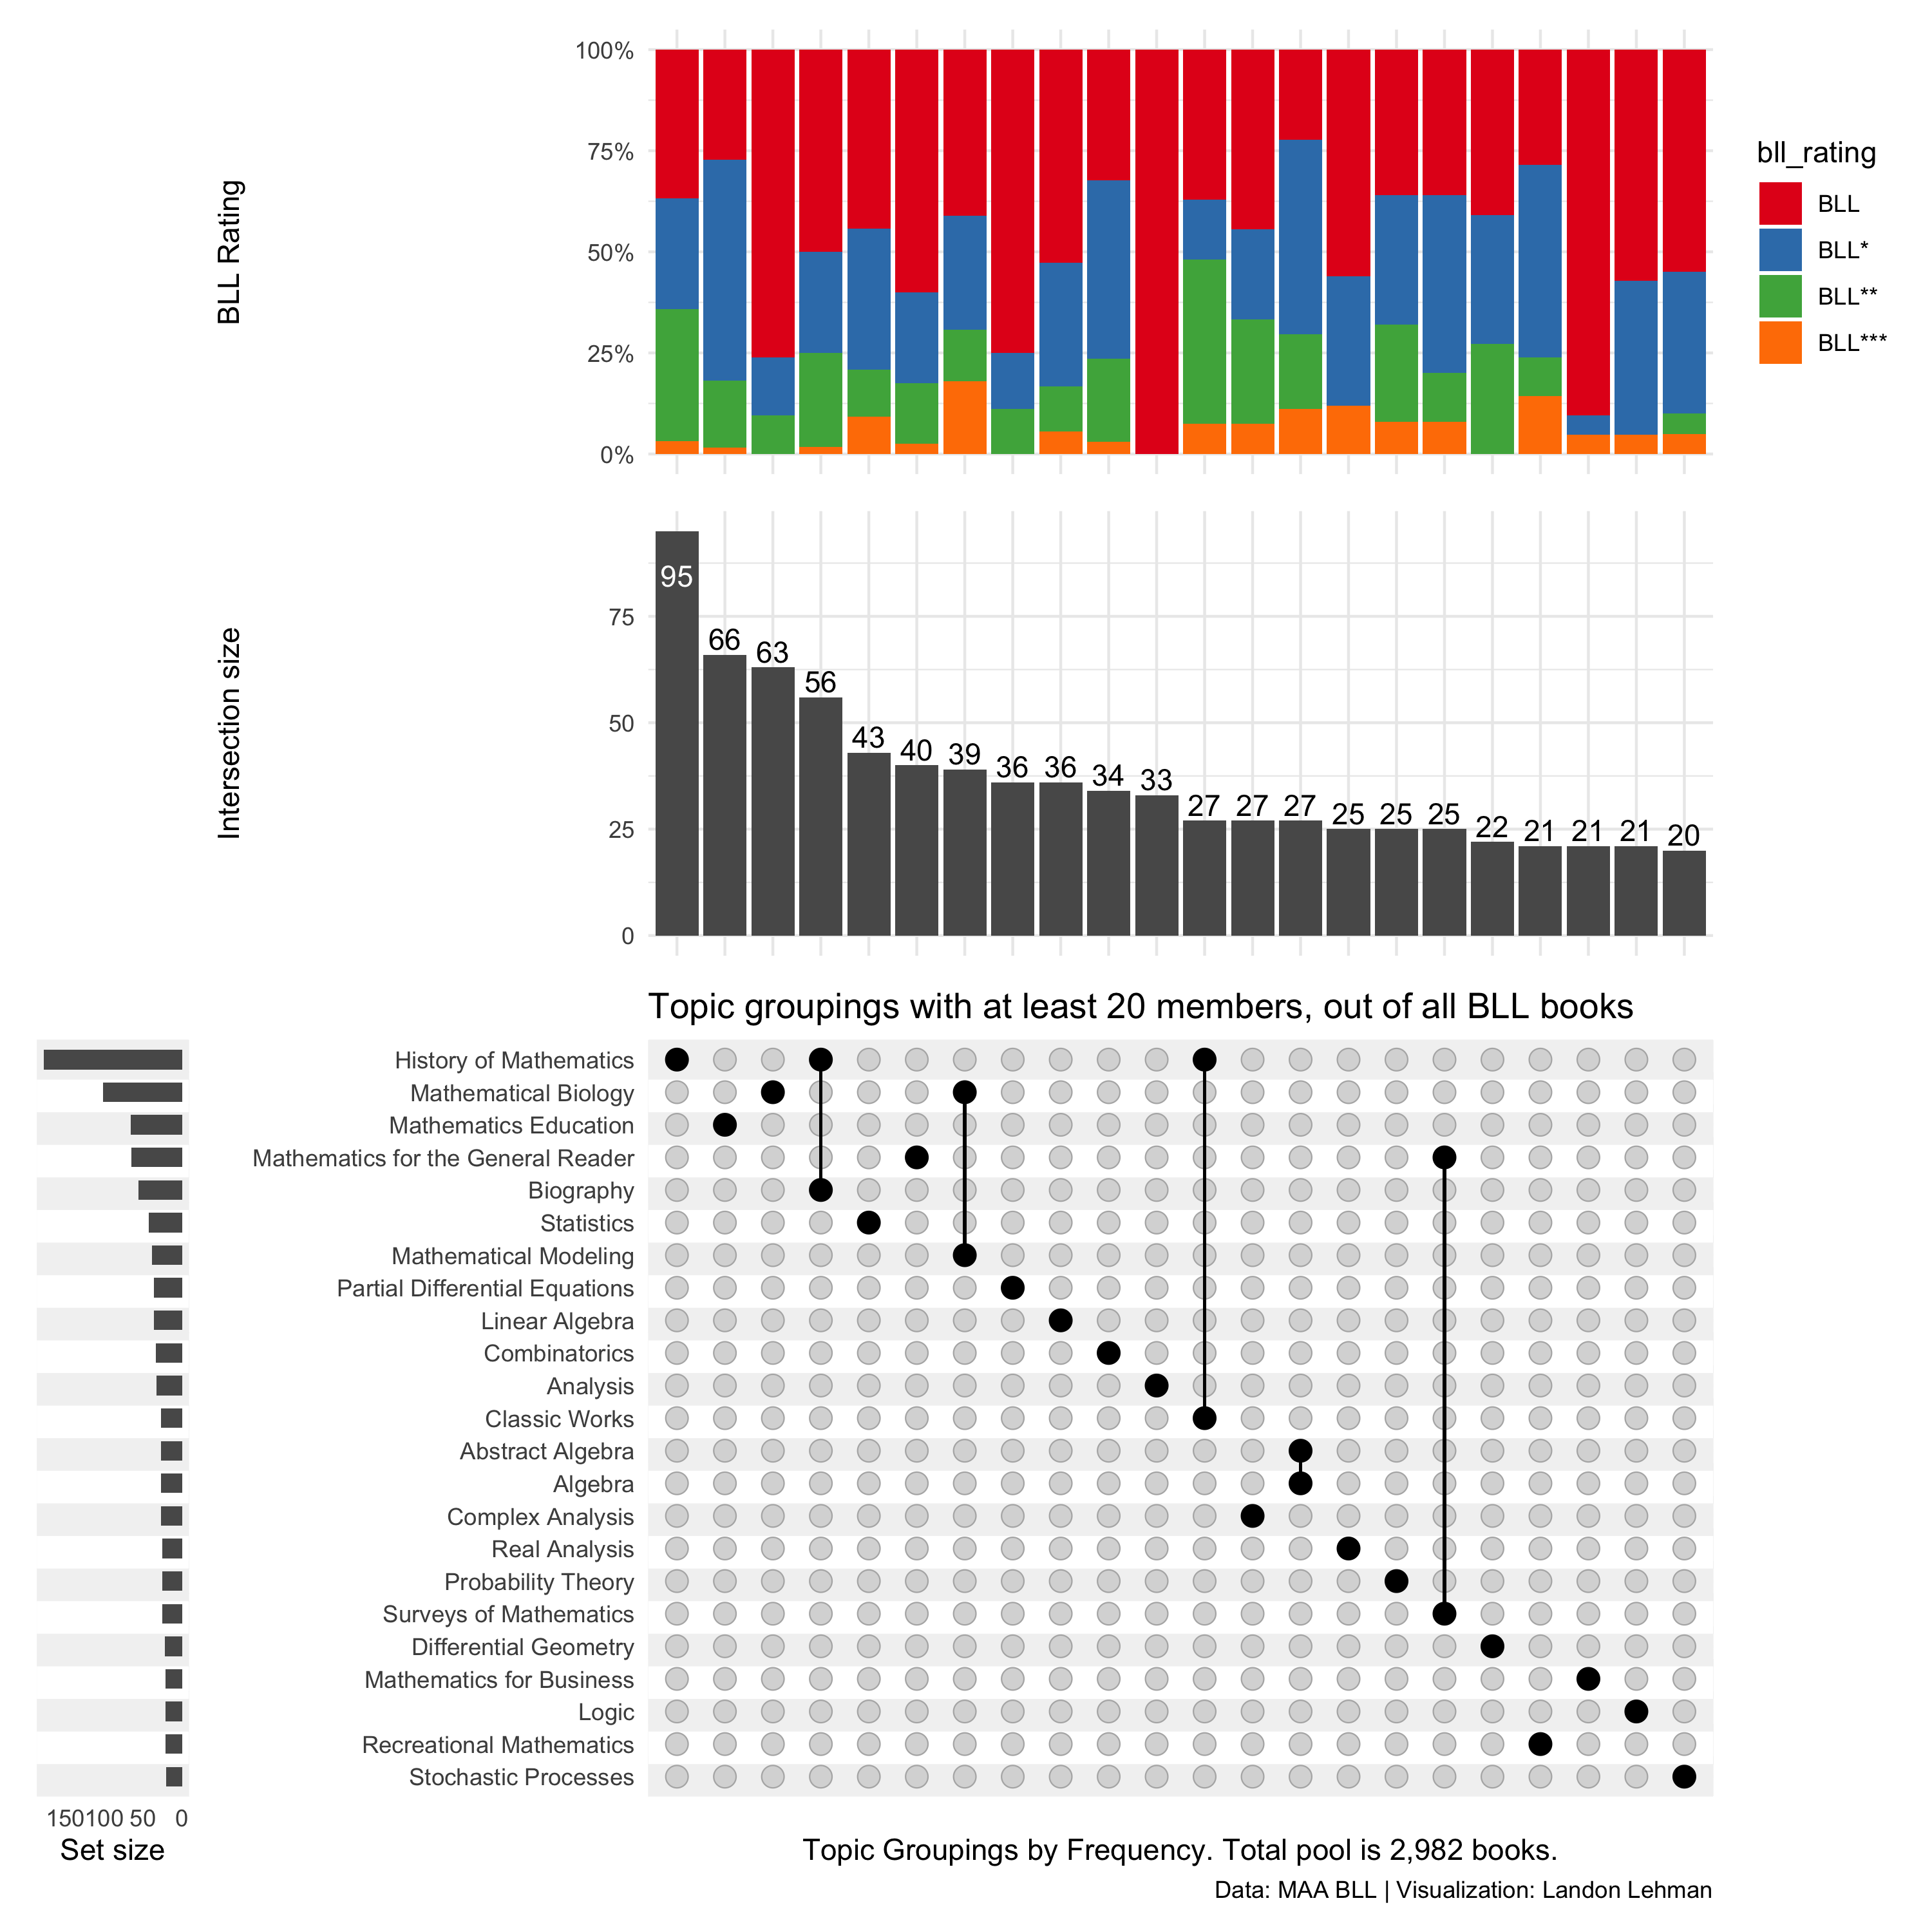
Here are the topic combinations that contain at least 20 books, along with the distribution of ratings for each combination:
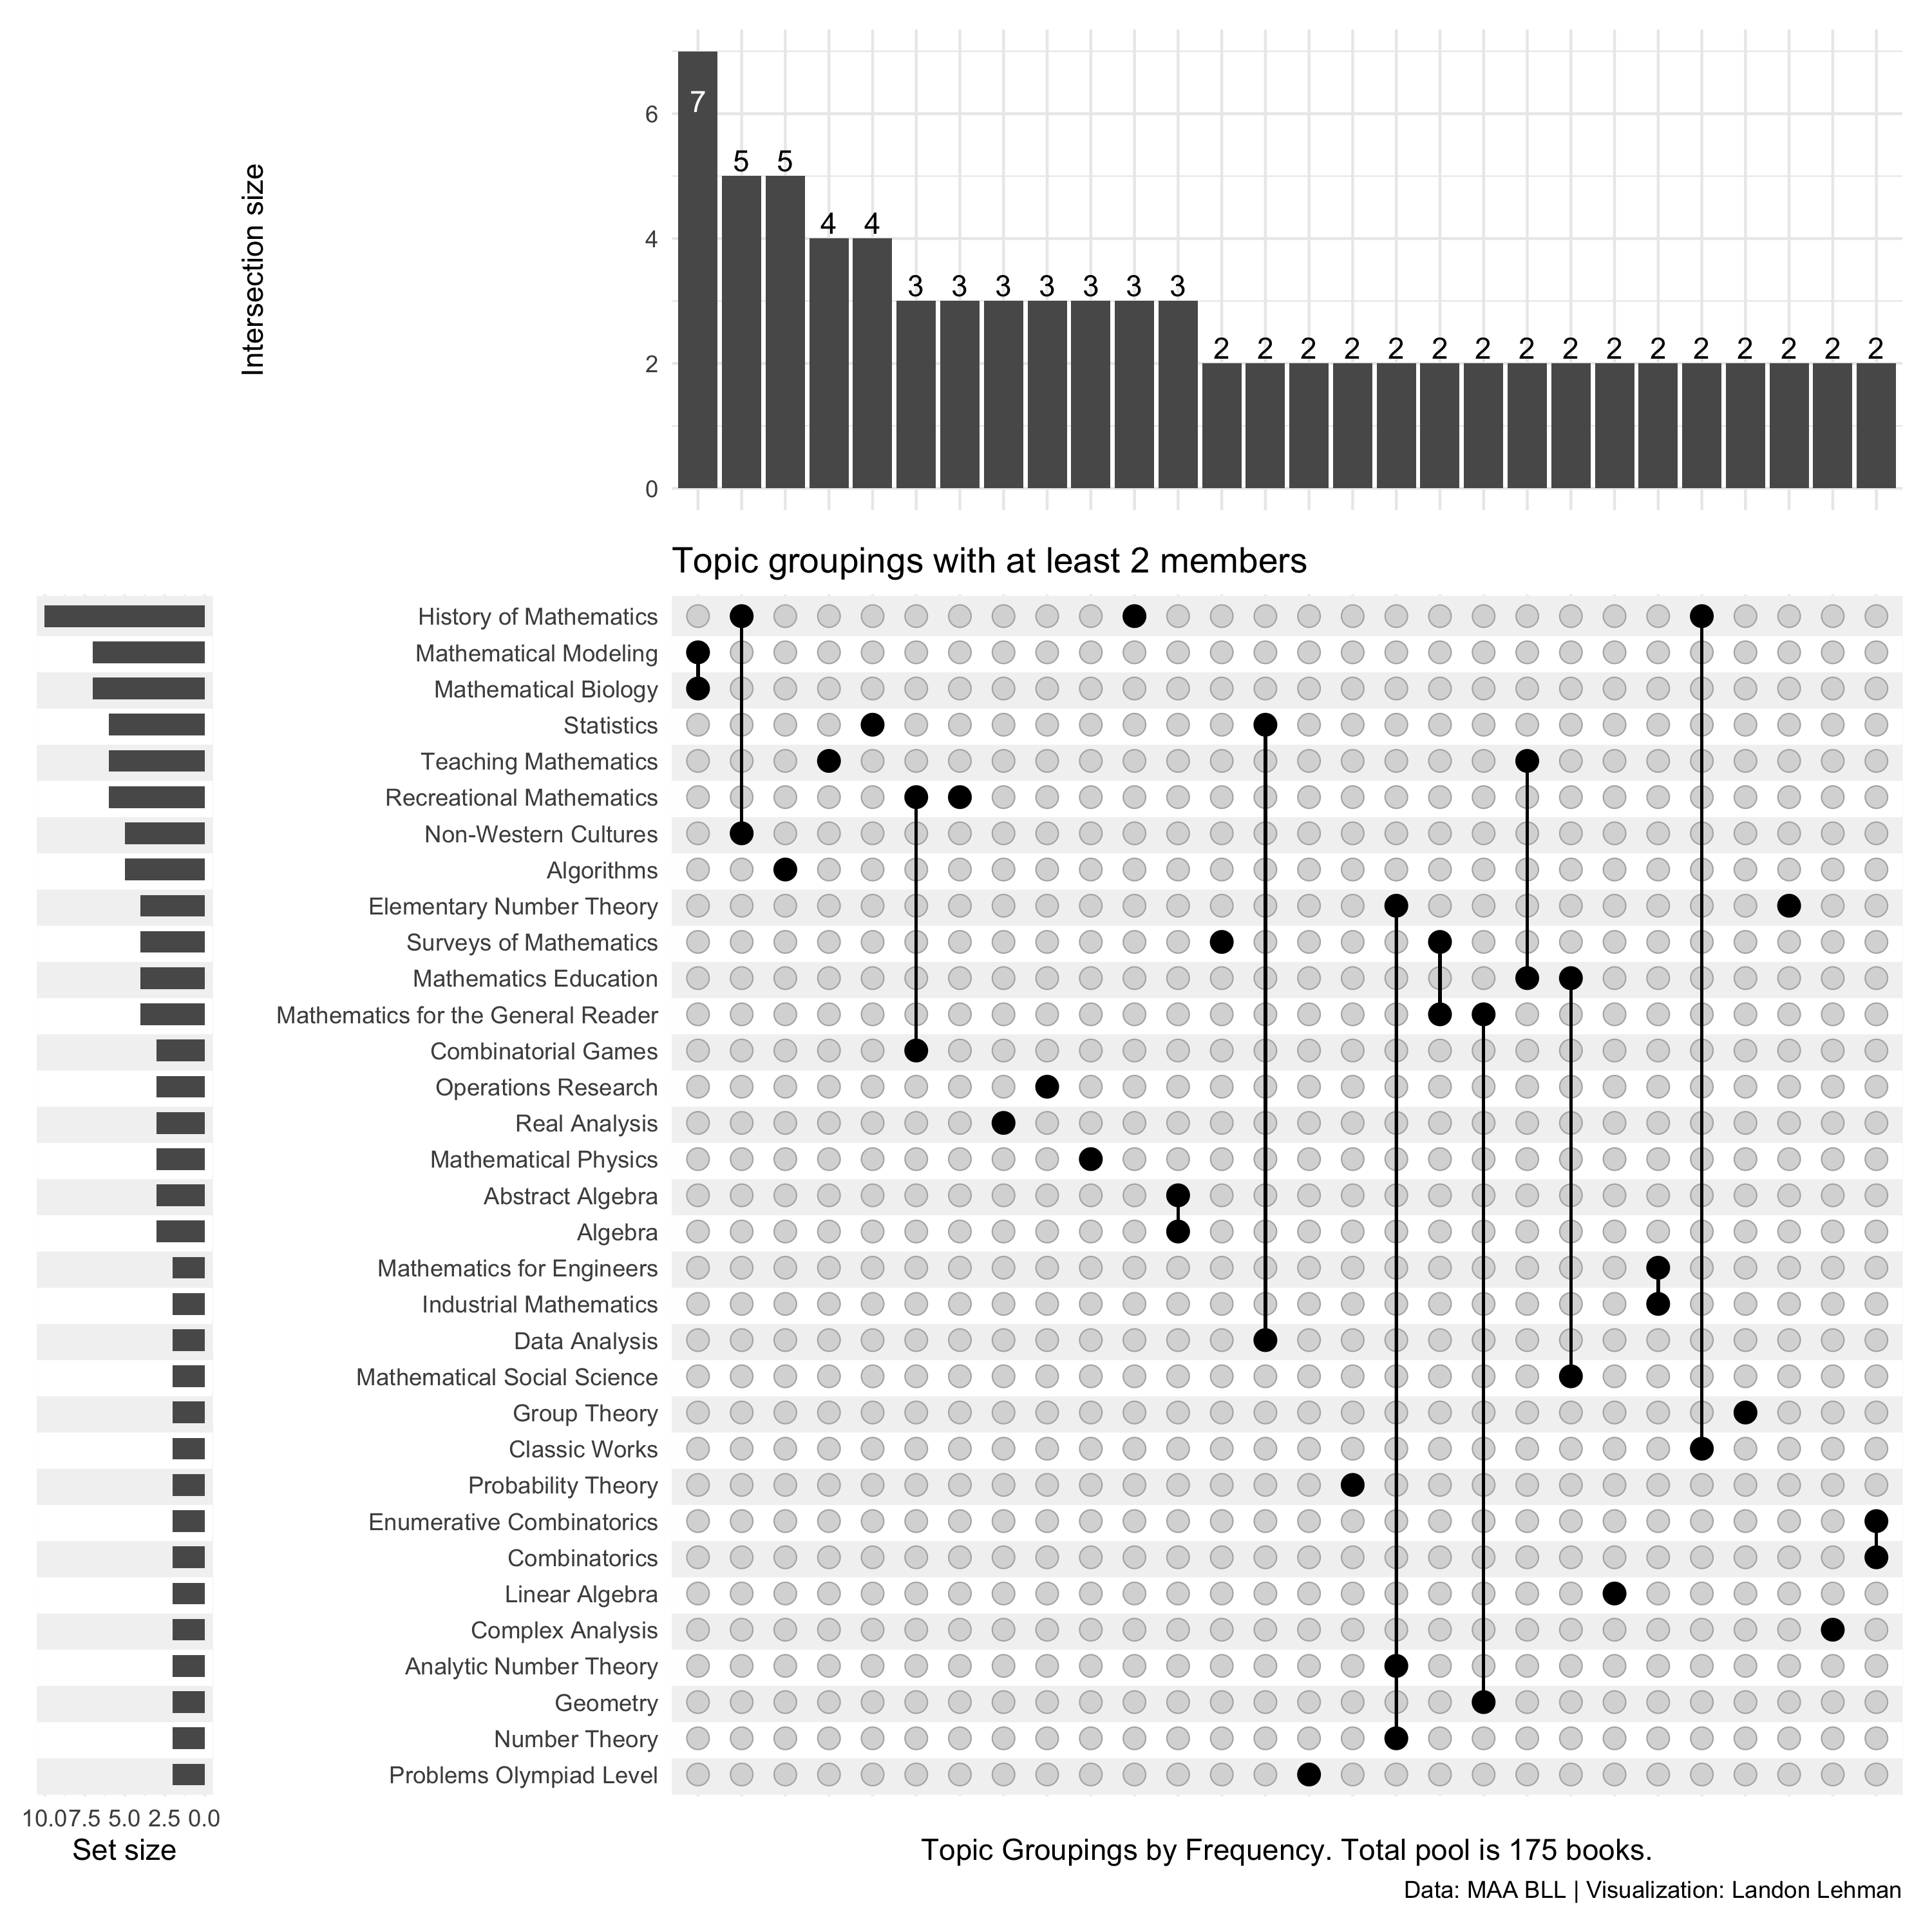
And here are the topic combinations for the books rated BLL*** (I restricted to combinations with at least 2 books):
For the visualizations, I used the most recent spreadsheet from the BLL (the one updated on January 3, 2020). The latest spreadsheet can be found here. I did notice some differences from my previous post, which was based on an older spreadsheet. For example, previously there were 187 top-rated books: now there are only 175. I might take a look at the exact differences in a future post. Placing the spreadsheet under version control would make this easier (for example it could be saved as a csv file on github). This would also make it simpler to deal with some of the data quality issues I noted previously, and which still exist in the updated spreadsheet.