There is one weekend of CrossFit Regionals competition left in the 2018 season, and I thought it would be interesting to do some visualizations in order to get practice using R. I scraped the data from the CrossFit Games website and used the library jsonlite to parse it.
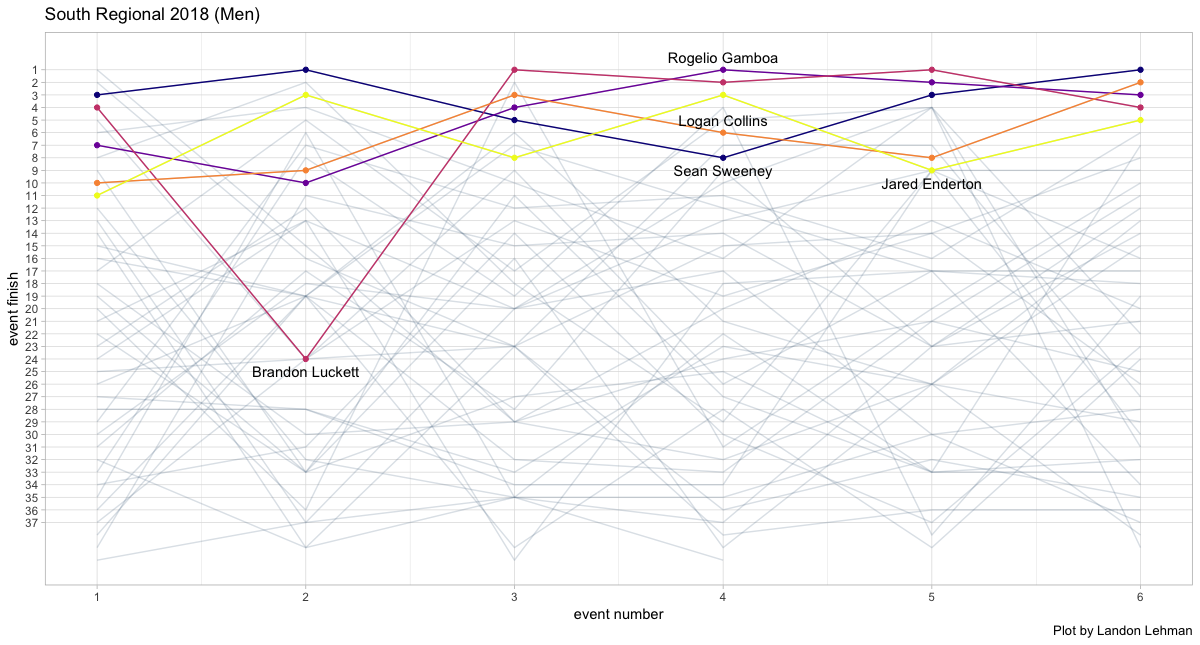
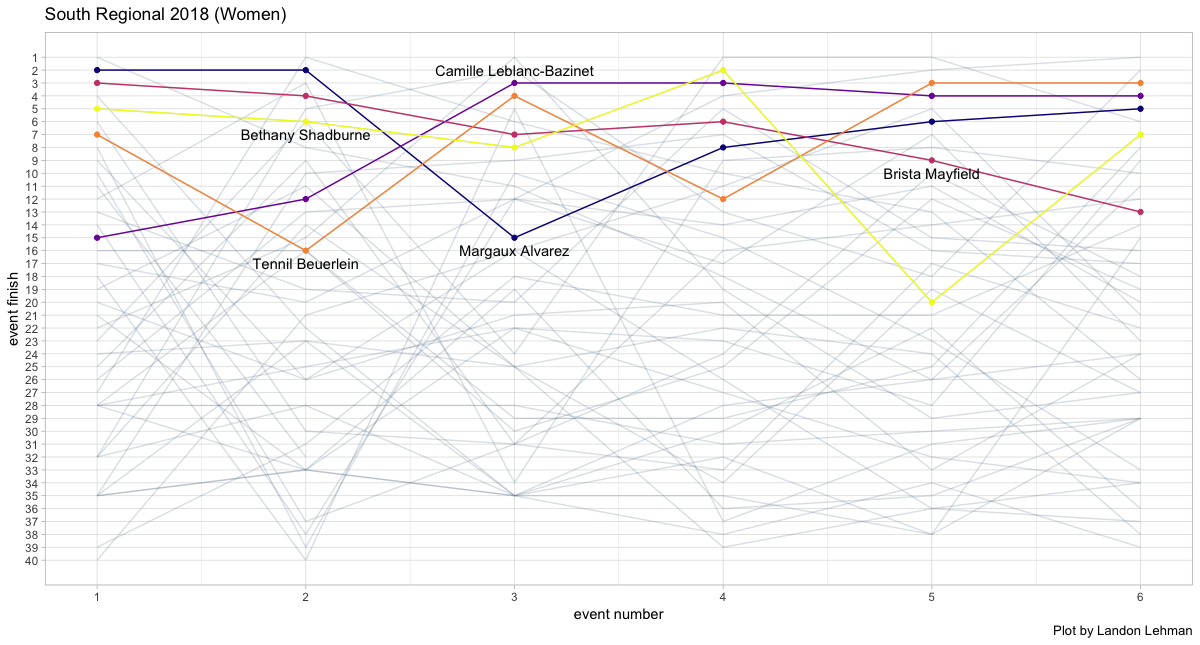
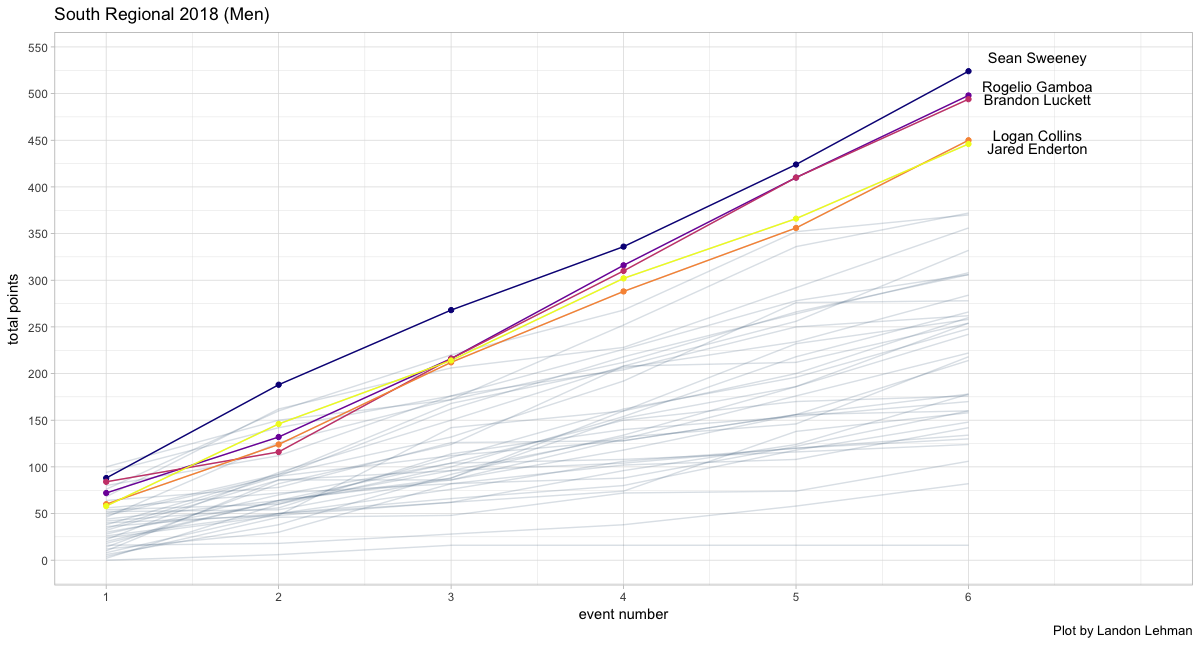
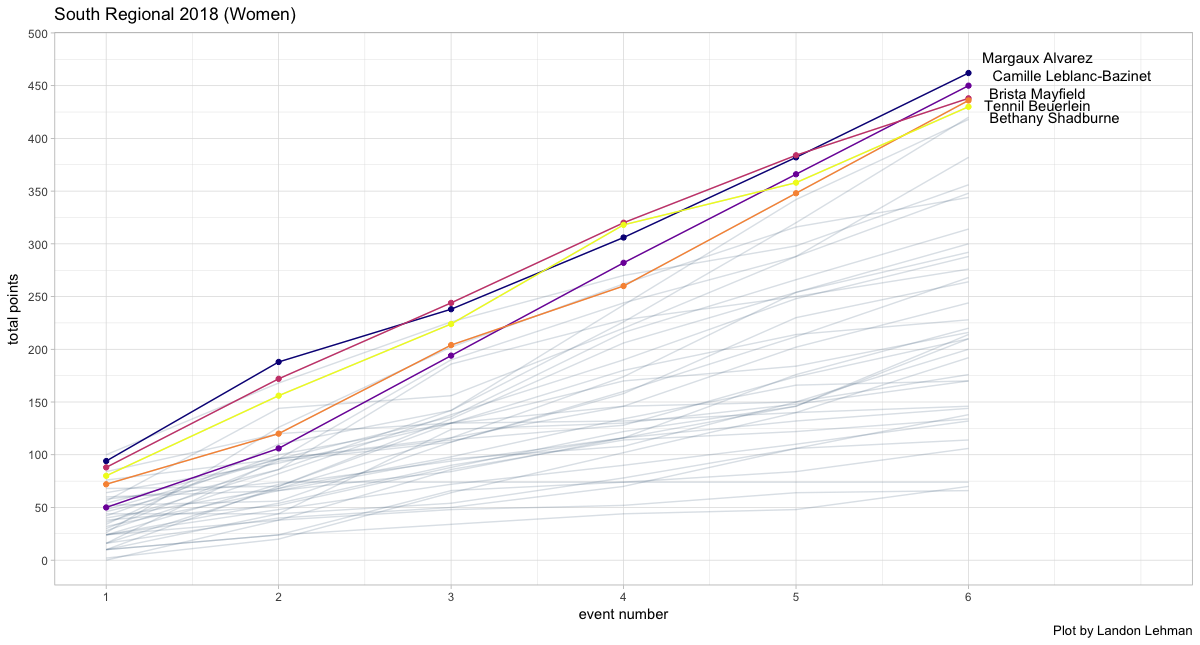
There were 3 regionals during the first weekend of competition (May 18-20): South, Europe, and East. I first decided to look at event finishes. All competitors who completed all the events (around 40 for each region) are shown as gray lines, with the top 5 finishers (the Games qualifiers) highlighted. For the South Regional:
For the Europe regional:
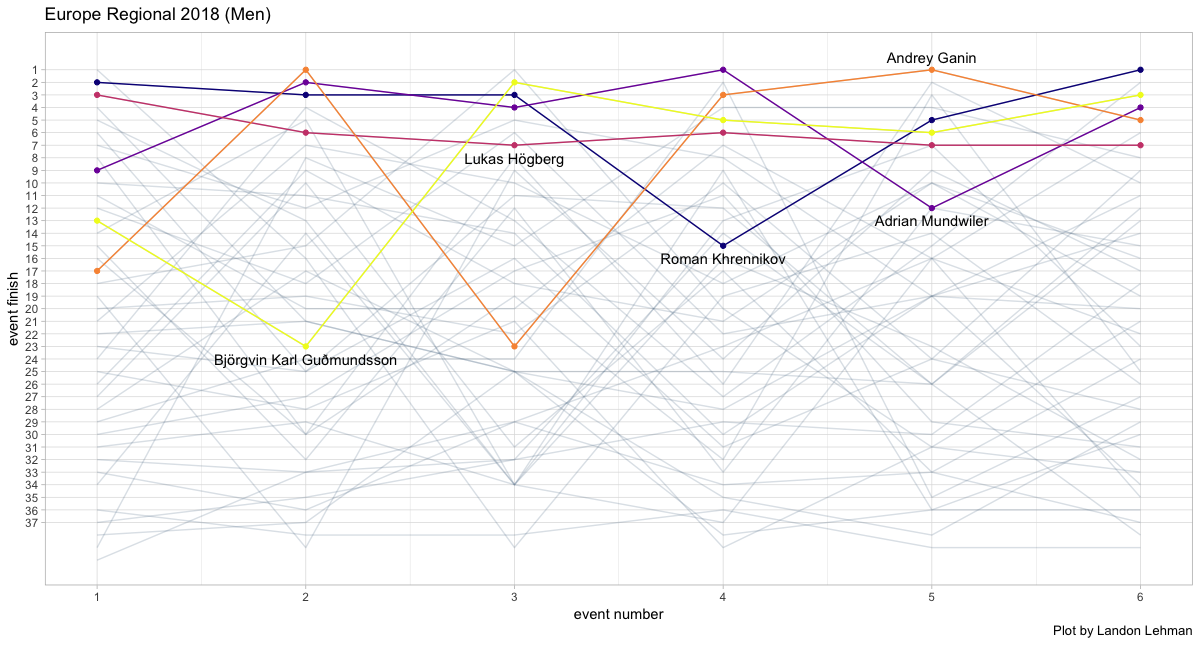
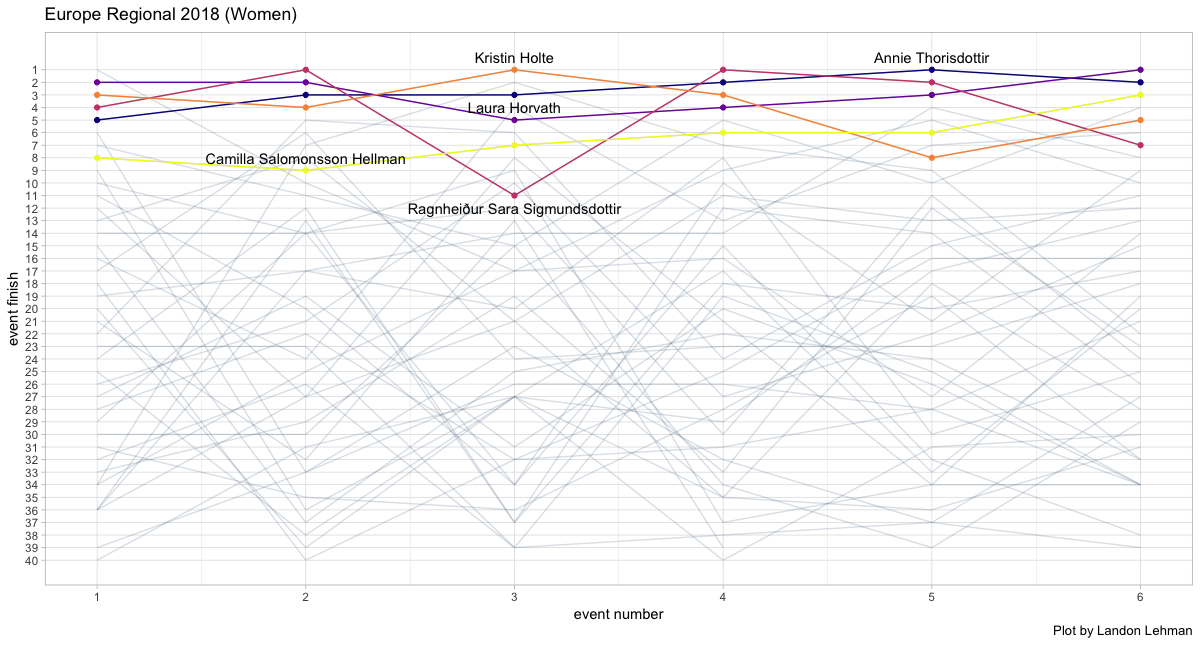
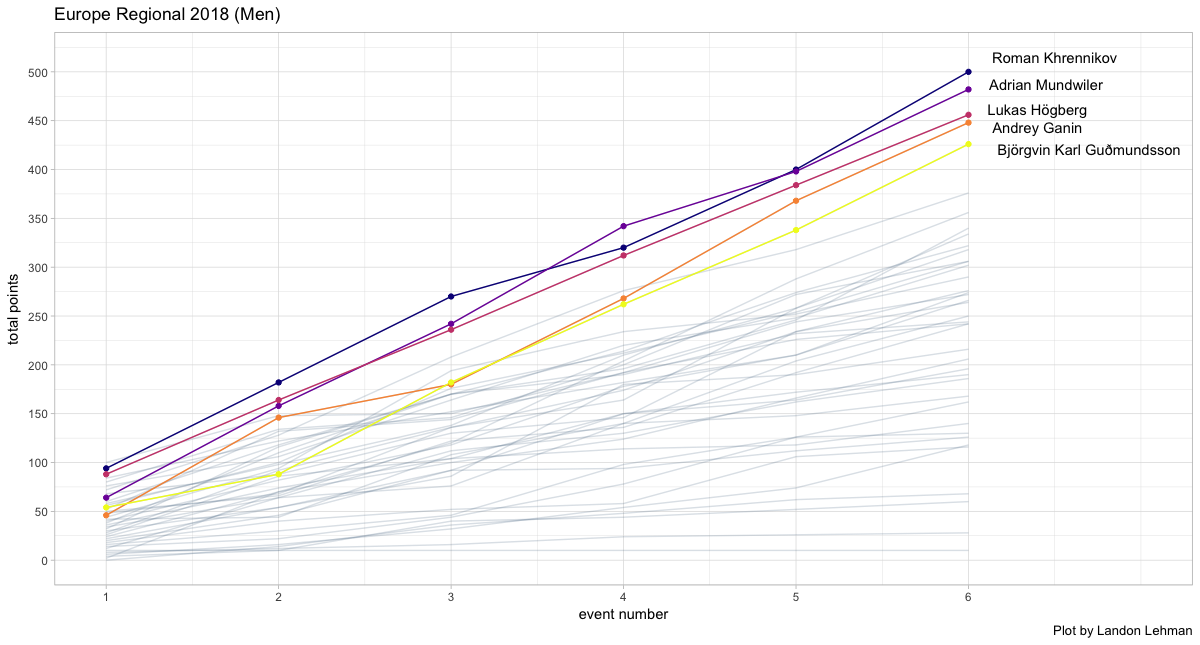
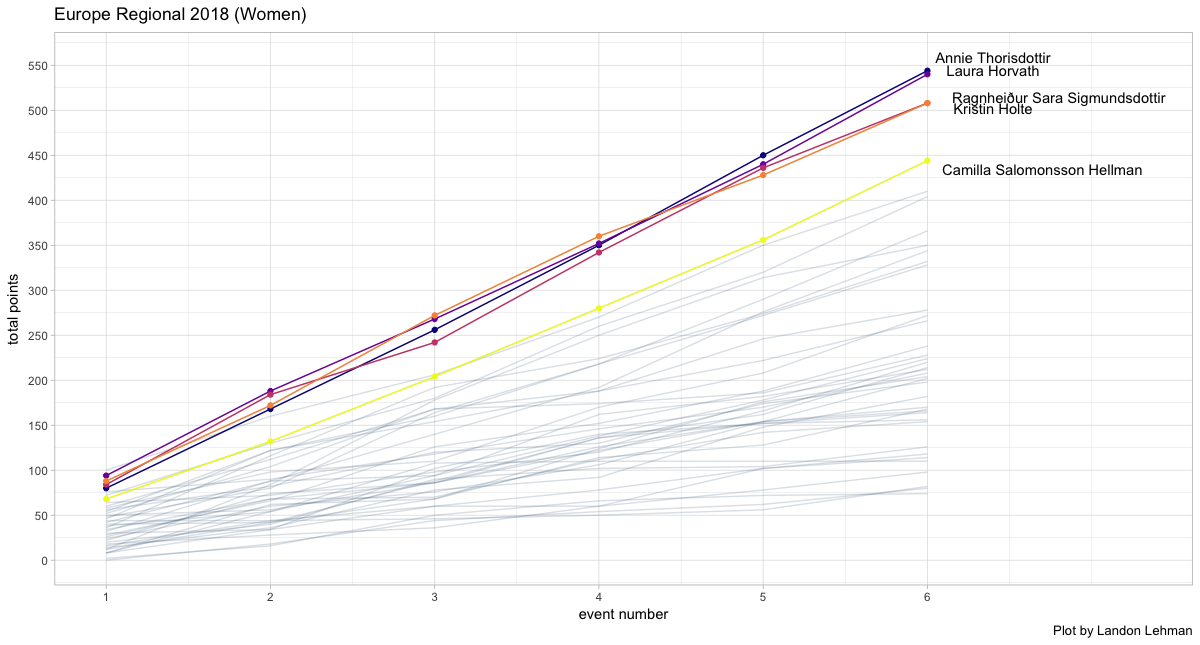
Note that the European female qualifiers have much more consistent top finishes than the European male qualifiers.
Finally, the East regional event finishes:
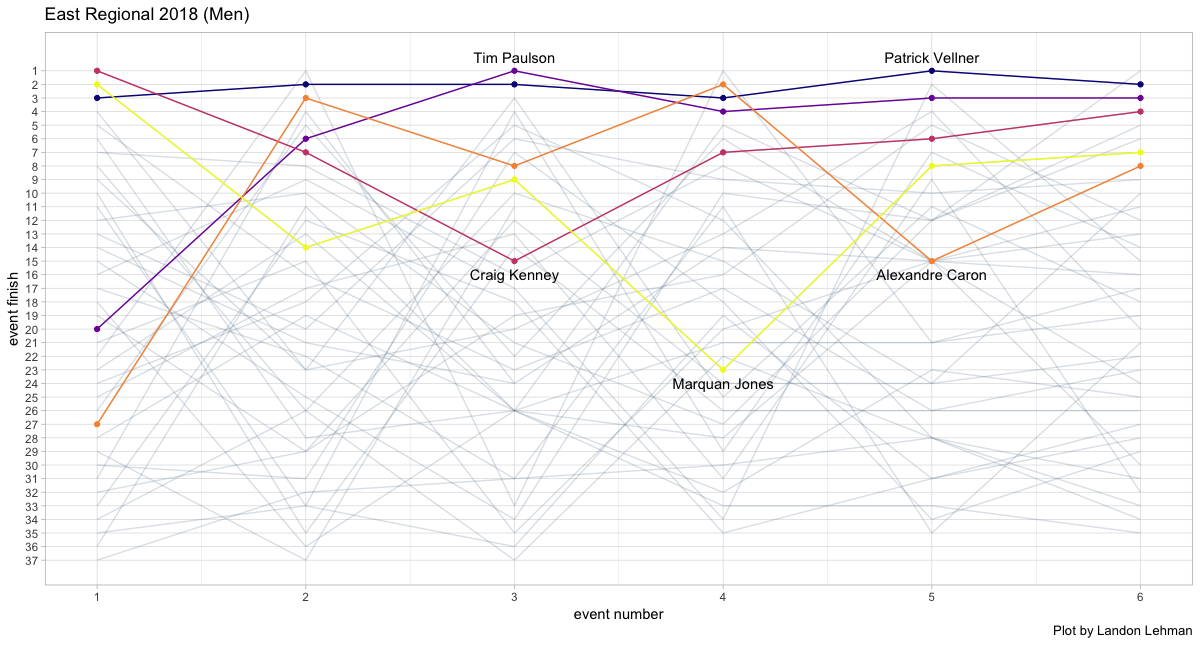
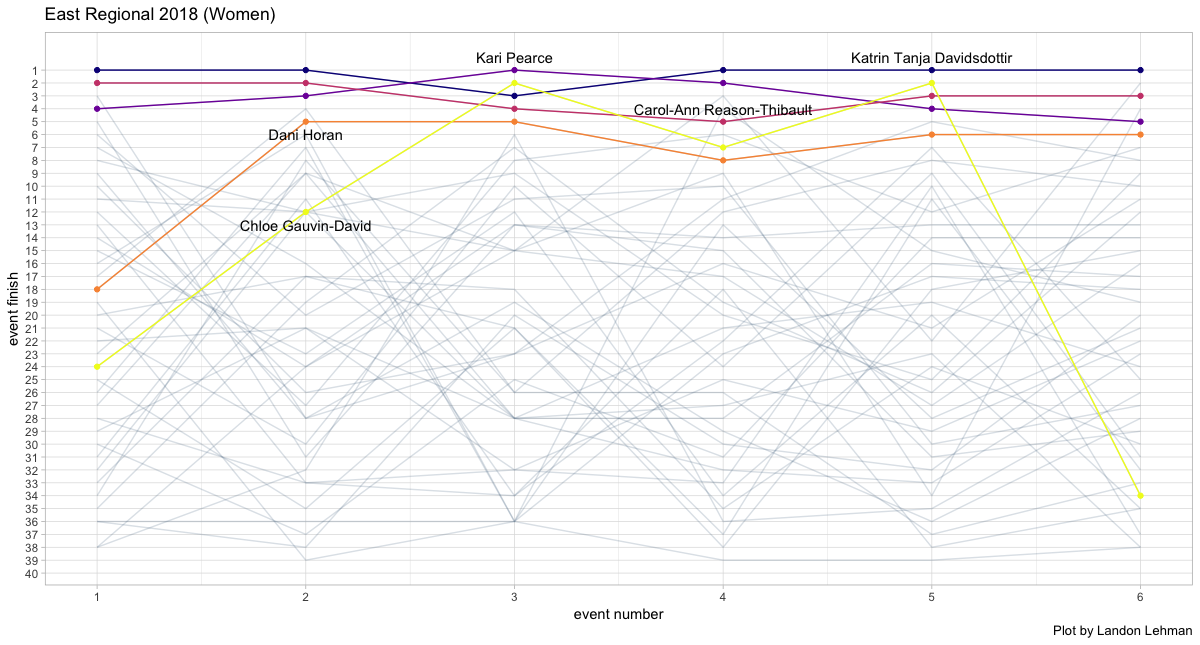
Again, the women seem much more consistent, with the exception of 5th-place finisher Chloe Gauvin-David. Also, if you stare at the gray lines long enough, it looks like there are groups of athletes in each regional who “zig-zag” their finishes across events. This zig-zagging seems more prominent across the first 4 events and less so for the last 2 events.
Another way to visualize the results is to look at the cumulative point totals. Again, all competitors who completed all events are shown in gray with the top 5 highlighted. For the South:
For the Europe regional:
And finally the East regional:
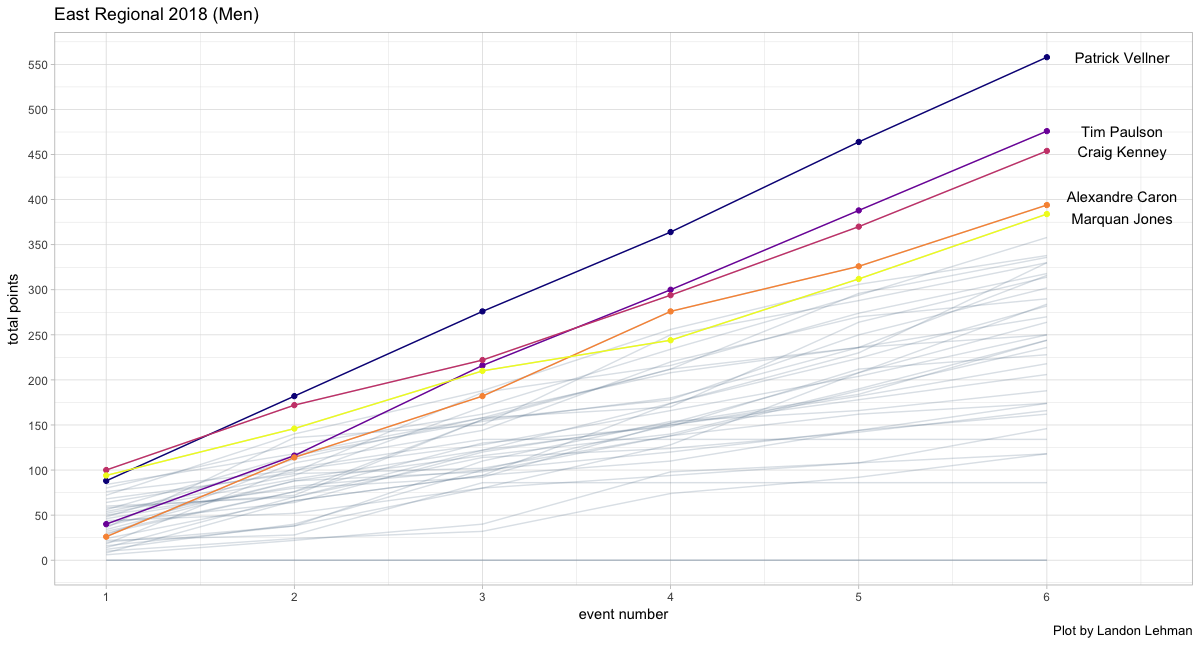
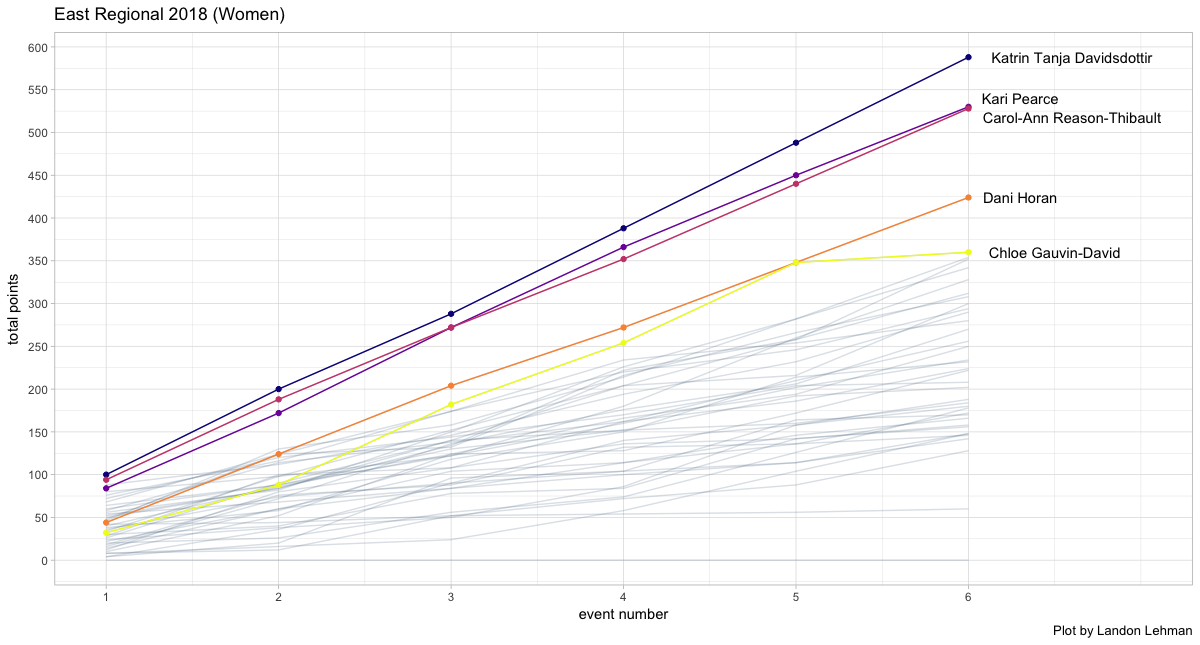
Just glancing over the cumulative points plots, you can immediately see the dominance of Patrick Vellner and Katrin Davidsdottir in the East Regional.
I’m planning to follow this up with visualizations for weeks 2 (already finished) and 3 (coming up this weekend). I also have some ideas for cross-regional comparisons. Let me know if there is anything specific you would like to see!